
Privacy-focused graphing
Create graphs and pivot tables online from CSV, Excel or JSON data.
Koia is an open-source web application for visualizing and analyzing table-like data structures. It is a simple and privacy-focused tool for everyone who just wants to create graphs without having to be worried about registration or subscription fees.
With Koia, you can effortlessly create meaningful graphs while having total control over your data. The context to the original data is never lost. You are always only a mouse click away from seeing the raw data on which the displayed element or value is based.
Besides this, Koia enables you to switch between multiple data sets, so it is possible to create graphics based on different data without opening a lot of tabs in your browser by switching between the data sets in one tab.
Open-source
The source code is and will always be publically available and can be inspected, modified and enhanced by anyone. Koia runs on public web servers but can also easily be installed in your trusted environment.
Data protection
The web application loads static content from a website but your data never flows back to it. It only travels between your browser and the data storage without ever being accesible to any unauthorized third party. You decide whether the data is kept locally or in a private external data storage.
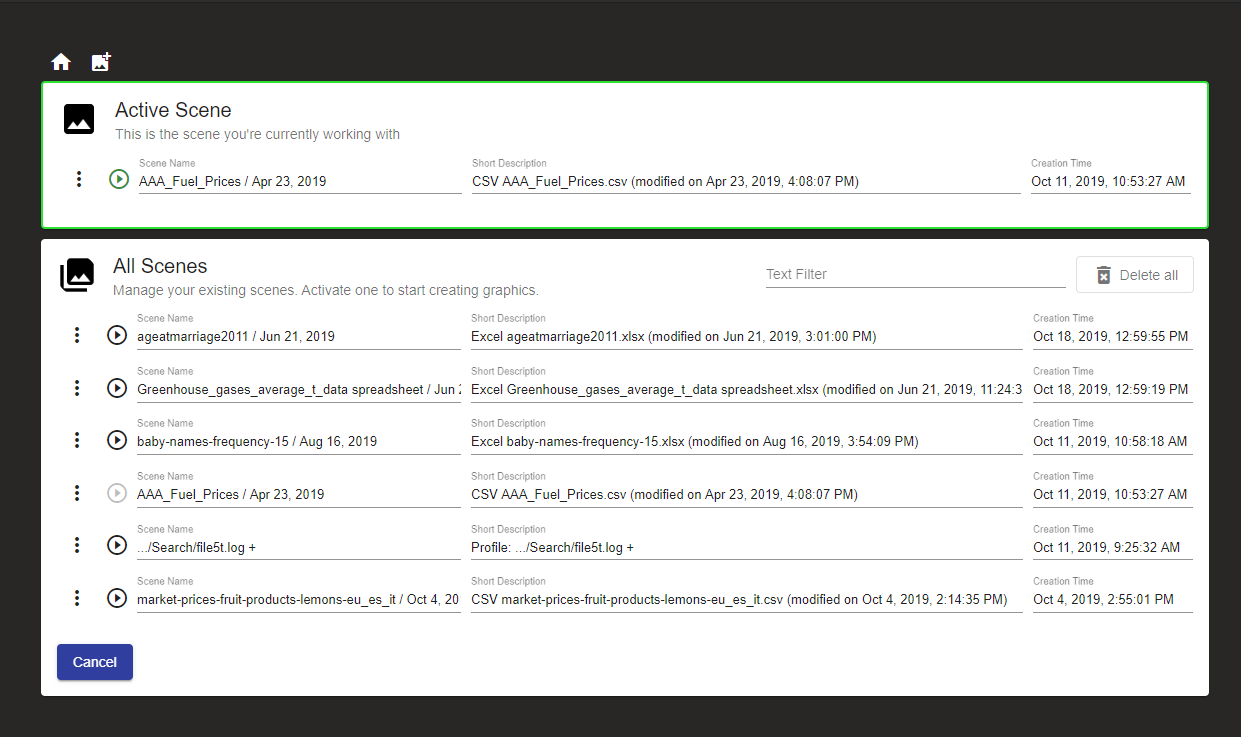
Data loaded from an individual file are represented by a scene. You can switch between different scenes as you please to create diagrams based on different data.
It is also possible to load data through a third party program like Retrospective Log Analyzer.
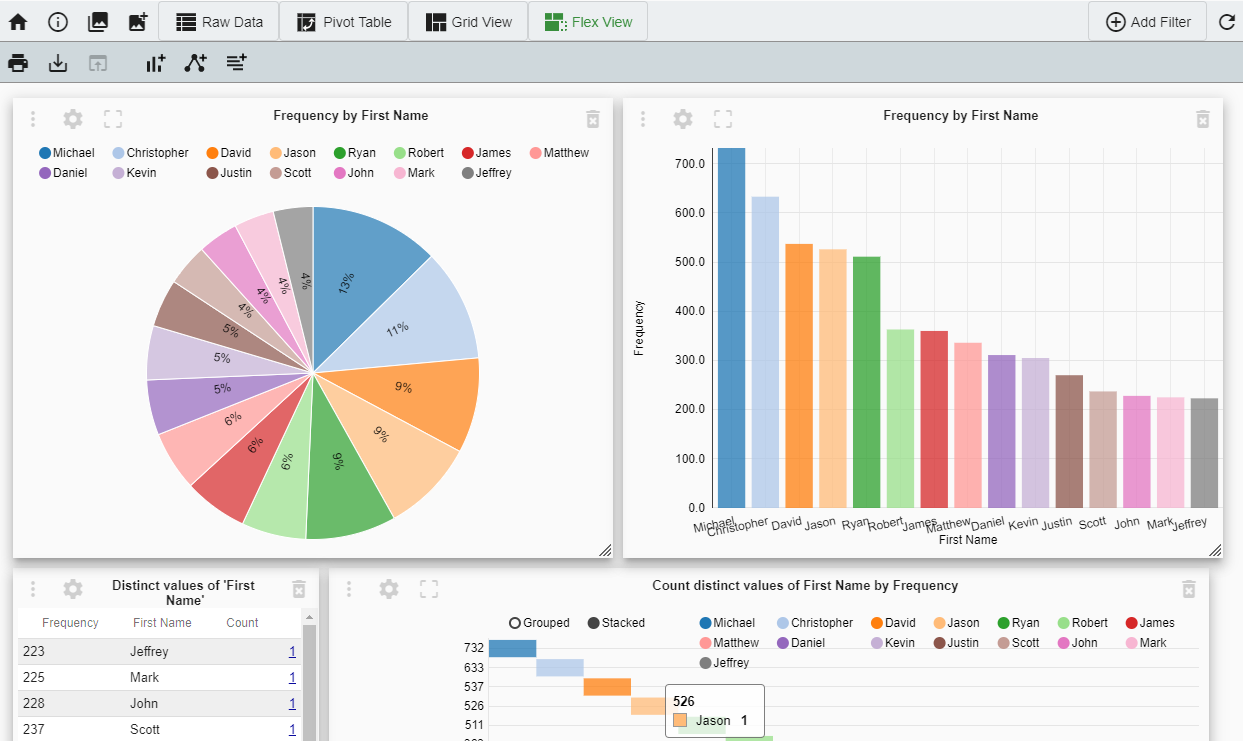
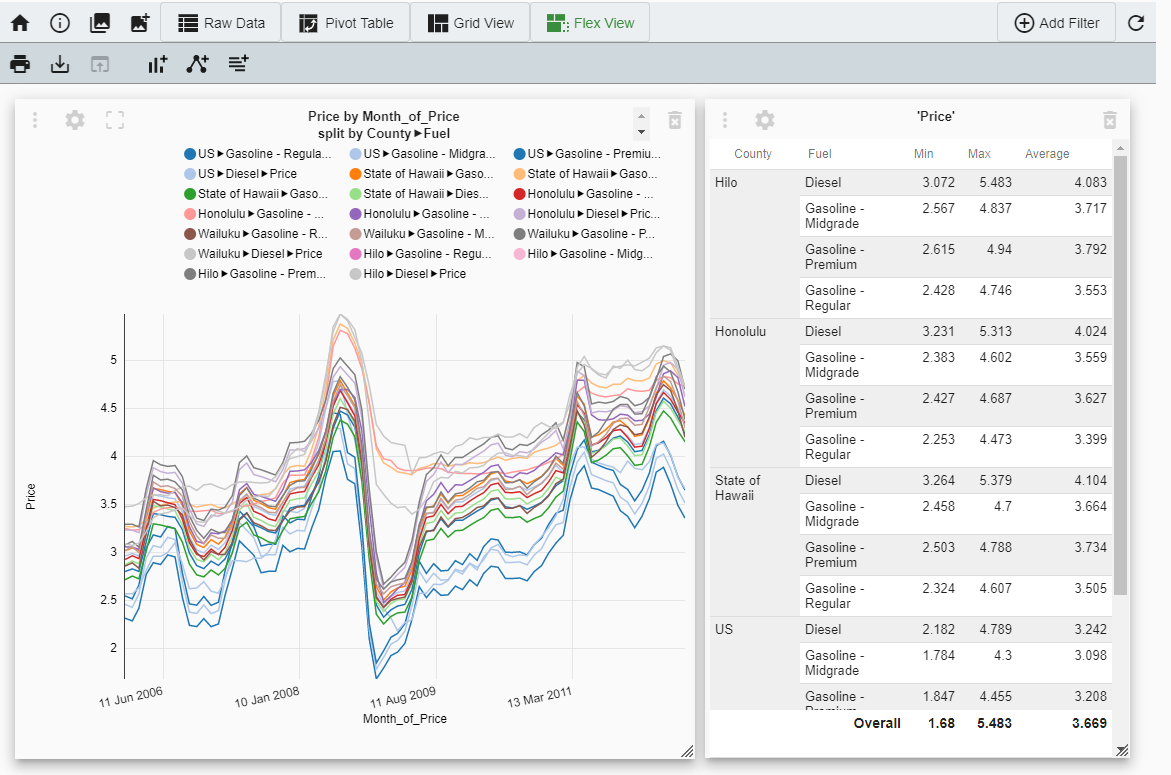
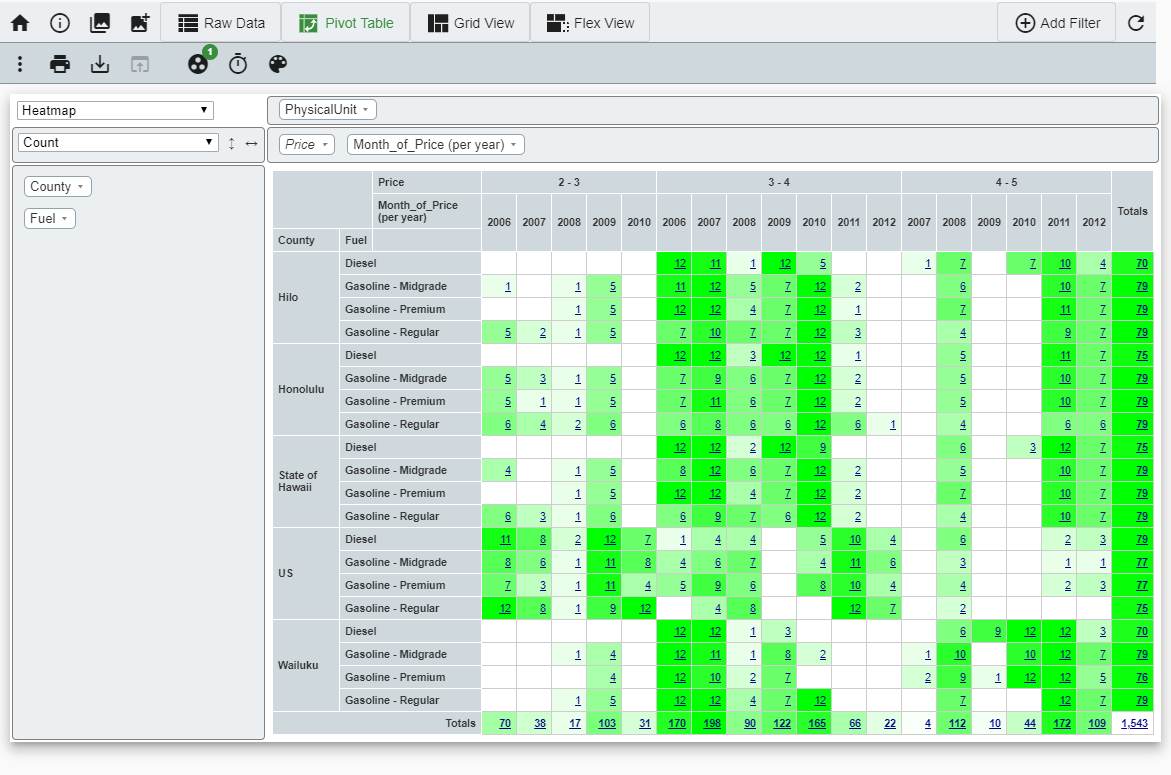
The data can be viewed and sorted in a raw data table or it may be refined and displayed as charts, relationship graphs, summary or pivot tables with a few mouse clicks.
Koia offers a variety of chart types such as: Pie charts, doughnut charts, bar charts, radar charts, polar area charts, line charts, area charts and scatter charts.
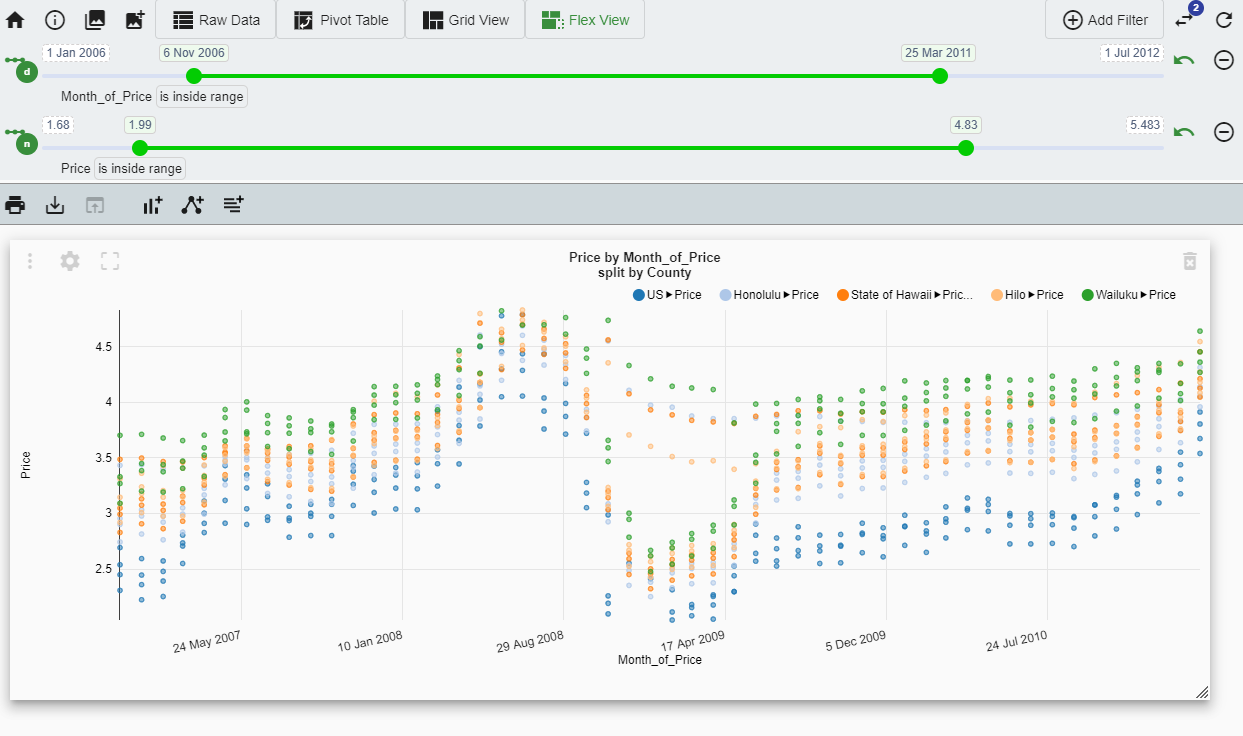
Besides simply visualizing data, Koia also features time and value filters to present a closer look at diagrams and the numbers behind them.
When satisfied with the outcome, you can save the current view or export data to use it elsewhere.
Create graphs, summaries and pivot tables with a few mouse clicks